There is a kind of incident that never becomes an incident.
A partner file is due at 06:00. At 06:00 it is not there. Nothing failed, because nothing ran. No exception, no 5xx, no retry storm, no stack trace, nothing in the log because there was no attempt to log. Every dashboard you own is green, and every dashboard you own is telling the truth. The system is not broken. It is empty.
At 09:30, somebody in operations asks whether the file has arrived yet. That question is your alert. It is accurate, it is correctly targeted, and it is three and a half hours late.
Two separate things went wrong here, and they are worth separating, because most teams fix one of them and assume they are done.
Absence is not an event
Monitoring inherited its instincts from request/response systems, where failure is loud. A request errors. A queue backs up. A pod restarts. All of these produce something: a status code, a metric that moves, a line in a log. You can count events, sample them, threshold them, page on them.
Absence produces nothing. There is no event emitted when a file does not arrive, no span for the job that did not run, no error from the partner who did not send. You cannot alert on a thing that generated no data, and no amount of instrumentation on your own side changes that, because your side is behaving perfectly.
The only way to detect absence is to have said, in advance, what presence was supposed to look like. That is the trade: you give up a little configuration, and in return silence becomes a signal instead of an ambiguity.
In Sluicio, that promise lives on the integration. Each one carries an expected traffic rate, which is a fairly boring way of saying you tell it roughly how often this flow should be moving something. When the traffic falls away, the integration’s status changes to quiet, which sits alongside ok, errors and unhealthy as a first-class state rather than as a gap in a graph. A flow that should run hourly and has not run since 02:00 is now a fact on a screen, not an inference somebody has to make.
Late is the other half, and it is a different question from missing. delayed_trace_count tracks messages that are in flight past when they should have finished: the file arrived, the job started, and it is still going at 06:40 for something that normally takes four minutes. Nothing has errored there either. It is simply not done, and “not done yet” is the state that turns into an angry phone call around lunchtime.
Between them, quiet and delayed cover the two failure modes that generate the most business pain and the least telemetry.
Now for the harder half: who is it for?
This is the part I spent years getting wrong.
Suppose you do catch it. The expected-rate check fires at 06:30. It goes to the on-call engineer, because that is where alerts go. The engineer, who is on call for forty services and has never heard of this partner, reads something like:
integration.status = quiet· INT002 · no traces in 4h · warning
and now has a research project. Which partner is INT002? Which country? Does anybody care at 06:30, or can this wait until 09:00? Who do I even tell?
Meanwhile the person who can answer all of those questions instantly, and who is the only person whose day actually changes, is not on the escalation path at all. They will find out at 09:30, the usual way, by asking.
So the alert was technically a success and practically a failure. It fired, on time, at the wrong human, in a vocabulary that human could not act on.
Fixing this is not an alerting problem. It is a modelling problem, and it gets solved earlier than you would think.
Make the thing that alerts you the thing they recognise
An integration in Sluicio is not a service and not a pipeline stage. It is the business flow: “Orders”, “Payments”, “Document Intake”. It carries the metadata that makes it identifiable to a non-engineer, like which country or partner it belongs to, and priority tags like P1 or P3 that say out loud how much anybody should care at 06:30 on a Sunday.
Do that, and the alert stops being a lookup:
Orders (Germany, P1): no traffic since 02:00, expected hourly.
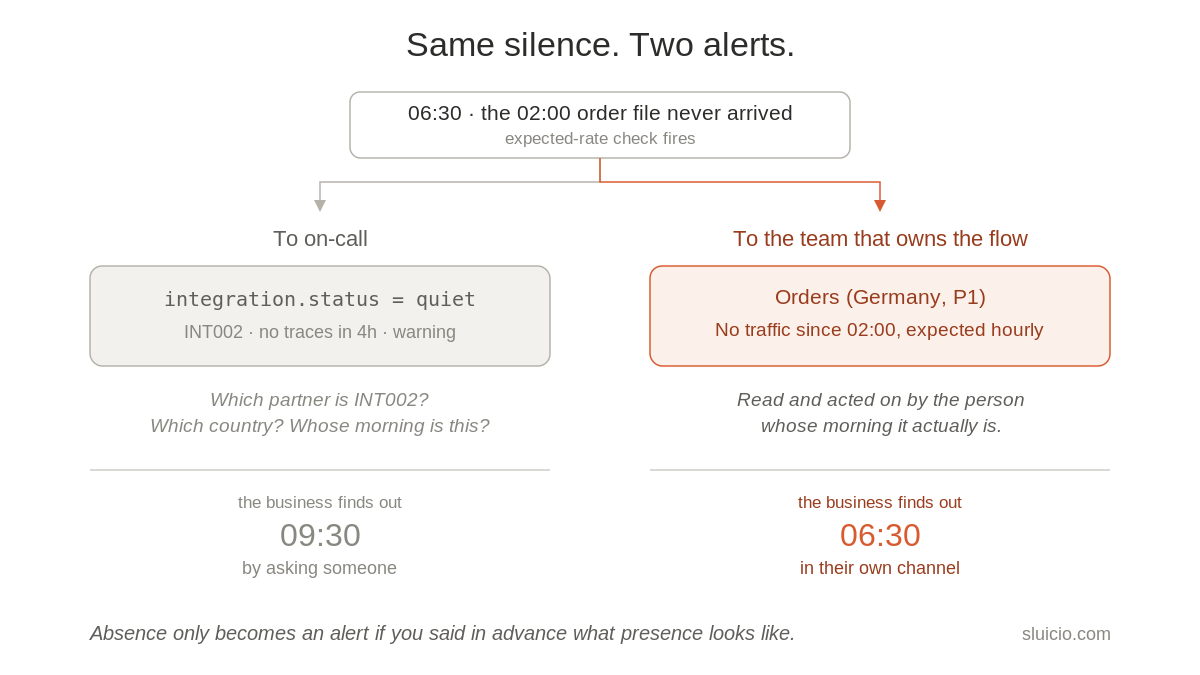
Nobody needs to translate that. The operations lead reads it as fast as the engineer does, arguably faster, because they know what the German order file is for and the engineer does not.
The last step is delivery. Alert rules route to notification channels, and groups control who sees which integrations, so the team that owns the German order flow gets the 06:30 ping in their own channel. On-call still gets the things on-call should get. What changes is that the business is no longer downstream of an engineer’s triage queue for information about its own operations.
What each side gets back
For the business: they find out first, in their own words, at 06:30 instead of 09:30. Three hours is often the difference between “we can still make the cutoff” and “we are explaining ourselves to a customer.”
For on-call: fewer interrupts that were never engineering problems. A late partner file is usually not a system fault, and routing it to an engineer by default has always been a slightly odd habit. The alerts that do reach them arrive pre-labelled with a priority somebody actually reasoned about.
For the relationship between the two: conversations start at “the German order file has not run since 02:00” instead of “something seems wrong with orders, can you look at everything?”
Try it on one flow
Pick the integration that generates the most “has it arrived yet” questions. Give it an expected rate, so silence becomes a status. Give it a name and metadata that the business already uses. Point its alert rule at the channel where the people who care already are.
Then wait for the next quiet morning, and see who finds out first.
This is the first post in a short series on making integration monitoring readable by the people who depend on it, rather than only by the people who run it.