Node-RED is where a surprising amount of Europe’s integration work actually happens. Not in the architecture diagrams — those show the ESB — but in practice: a hundred flows quietly moving orders, sensor readings, and CSV files between systems, built by people who had a problem on Tuesday and a working flow on Wednesday.
And since node-red-contrib-opentelemetry exists, those flows can emit proper distributed traces: point it at an OTLP endpoint, and every message becomes a trace, each span tagged with node_red.flow.id, node id, node type. Genuine observability from a low-code tool. Lovely.
Then you open your observability tool and discover all of it is one service.
The problem: one service.name, a hundred flows
The package sets one service name for the whole Node-RED instance — that’s just how the OTel resource model works: one process, one resource, one service.name. Which flow a span belongs to lives in span attributes, and your service-centric monitoring doesn’t group by those.
So the service page for node-red is the average of everything it runs. The invoice flow fails all night? The service error rate ticks up, an alert fires on node-red, and whoever’s on call reads it as “the platform is failing” — when 99 flows are fine and one partner changed a field name. The reverse is worse: a low-volume flow dies completely, its errors drown in the volume of the healthy ones, and the service stays green. All services green, zero invoices. We’ve been here before.
A service is the wrong unit. The flow is the thing with a business meaning, an owner, and a 02:00 failure mode. So how do you monitor flows when the telemetry says “one service”?
Option 1: rewrite service.name in the Collector
The OTel-native fix: make each flow its own service. The Collector can do this — groupbyattrs promotes the flow id from span to resource, then transform renames the service:
Full config, rendered as a diagram you can actually read: here (made with OTelFlow — paste a Collector config, get a shareable flow diagram, free).
Does it work? Yes. Should you? Honestly — I’m not convinced, and I say that as someone who likes the Collector. Three reasons:
Flow ids are opaque. node_red.flow.id is a hex string, so your service list fills with nodered-a3f21bc4…. To get human names you maintain a mapping table in the Collector config — one that silently drifts every time someone adds or renames a flow in the editor. And “someone edits YAML and redeploys the Collector every time a flow changes” is precisely the workflow Node-RED people chose Node-RED to avoid.
Flow ids don’t survive moves. Export a flow to another environment and it can get a new id. Your “service” history resets; dashboards point at a ghost.
You’ve rewritten reality. service.name is supposed to mean “a deployable thing.” After the rewrite, every downstream consumer — sampling, service maps, other teams’ dashboards — sees a hundred services that don’t exist. That’s a lie you now maintain forever.
Verdict: legitimate for a handful of stable, important flows; painful as a general policy.
Option 2: leave the telemetry alone, match the flow
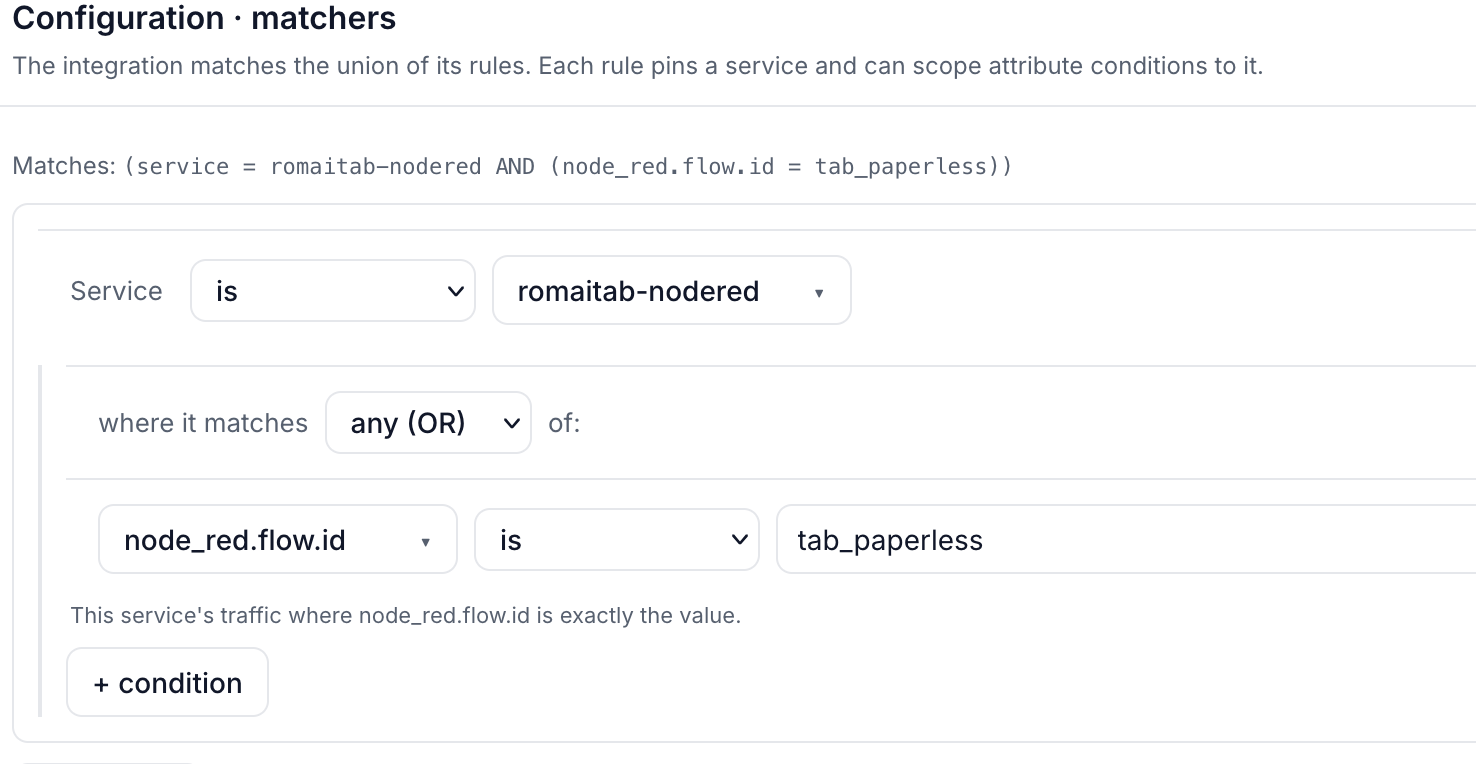
The alternative is to stop treating “what the telemetry says” and “what you monitor” as the same thing. In Sluicio, an integration is defined by matchers on attributes — so “the invoice flow” becomes:
service.name          equals   node-red
node_red.flow.name    equals   partner-invoices
(Name or id? Name — it’s self-documenting and survives export/import between environments, where ids can get regenerated. The risk is someone renaming the flow tab; but note the failure mode: a stale matcher means the integration stops matching traffic, and the expected-rate check flags it quiet within hours. A stale Collector mapping table just writes wrong service names forever, silently. If your flows are all named “Flow 1”, use the id — and also, name your flows.)
…and that flow is now a first-class object: its own health status, its own trace list, its own expected-traffic rate (so the quiet low-volume flow finally pages someone), its own P1 tag and owner. The telemetry stays exactly as the package sent it. No Collector redeploys, no invented services, no drift — if a flow changes id, you edit one matcher in the UI, not a pipeline.
Same trick scales across flows: each business-critical flow gets an integration; the long tail stays aggregated under the service until it earns individual attention.
The recipe, condensed
Instrument Node-RED with node-red-contrib-opentelemetry and ship OTLP. Resist the urge to shred one service into a hundred synthetic ones in the Collector — it works, but you’ll be maintaining a mapping table for a tool whose entire point is not maintaining config. Instead, monitor at the layer where the flow is the unit: match on service.name + the flow name (or id), give each critical flow its own health status and expected rate, and let the platform stay one honest service.
Your Node-RED instance is one process. It was never one integration.
Sluicio is self-hosted integration monitoring on OpenTelemetry. If your Node-RED admin panel is the only thing that knows which flow broke, book an intro call or poke the live demo.