Every OpenTelemetry tutorial starts the same way: a request arrives, spans fan out through your services, a response goes back. Lovely. Now explain that to an EDI flow.
Nobody “requests” anything from an EDI integration. A partner drops a file on an SFTP server at 02:00, and a chain of jobs picks it up, parses it, transforms it, and pushes orders into the ERP. There’s no user waiting, no HTTP status code, and, this is the important part, the worst failure mode isn’t an error. It’s nothing happening. The partner’s export job died on their side, no file arrived, and every one of your services is technically healthy while zero orders flow. For three days. Until sales calls.
So here’s how to actually model that flow in OpenTelemetry spans. Concretely, with attribute names you can copy.
The example flow
A classic partner order flow, four hops:
- edi-gateway — polls the SFTP server, picks up
ORDERS_ACME_20260721.edi - edi-parser — validates and parses the EDIFACT file into order records
- order-transformer — maps partner article numbers, enriches, converts to the ERP’s format
- erp-connector — POSTs the orders to the ERP’s API
Four small services (or four steps in one service, more on that later). No browser in sight.
Step 1: one trace per business event
The single most useful decision: the trace follows the file, not the request. Start the trace when the file is picked up; propagate that trace context through every hop, through the queue, if there’s a queue between steps, until the orders land in the ERP.
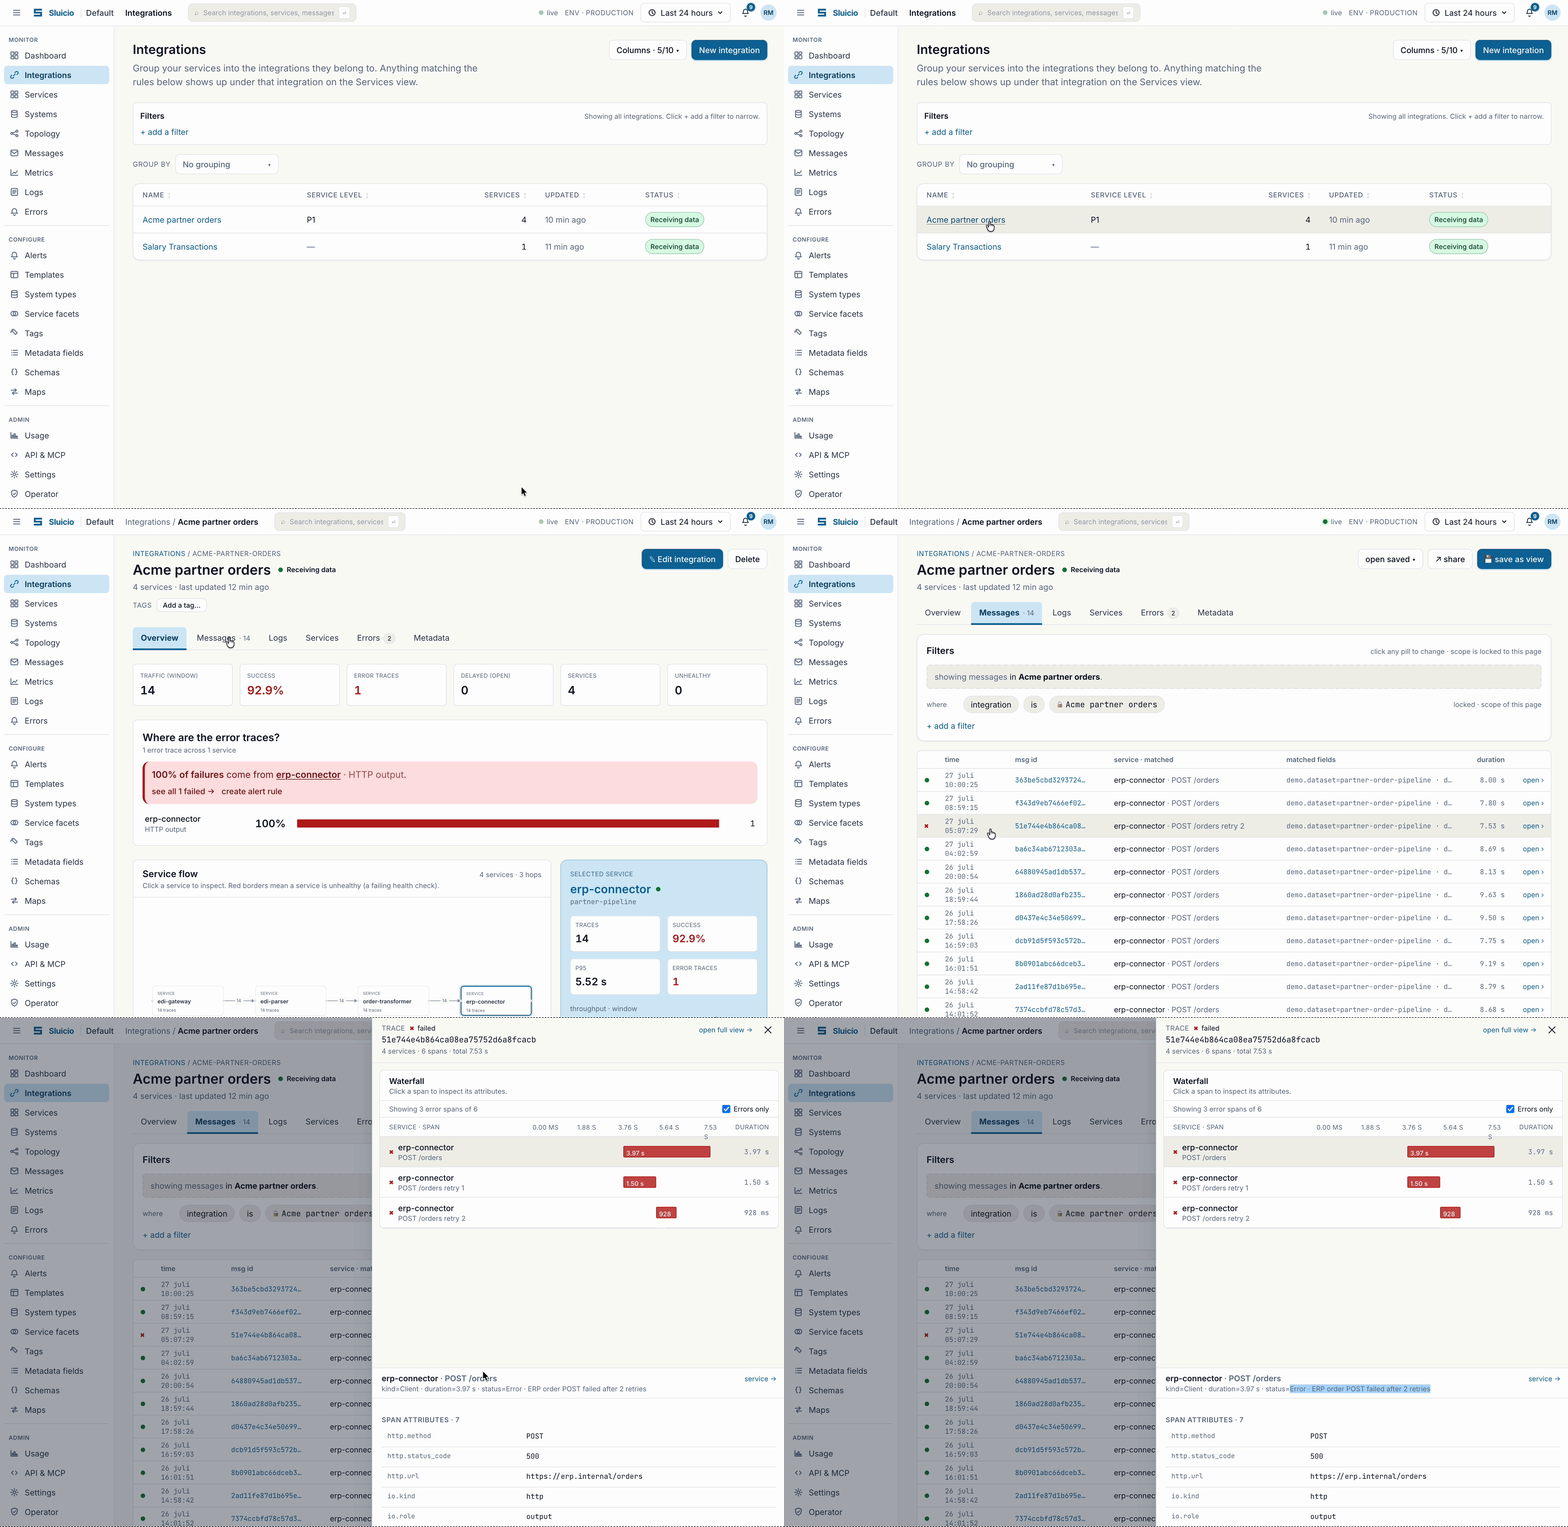
Do that, and “where is Acme’s order file from last night?” becomes a search, not an archaeology project. The whole journey is one trace:
ORDERS_ACME_20260721.edi                          trace: 8f3ac2…
├─ edi-gateway    receive file       (2.1 s)
├─ edi-parser     parse EDIFACT      (0.8 s)   47 orders
├─ order-transformer  map & enrich   (1.2 s)
└─ erp-connector  POST /orders       (4.3 s)   ERP said 201
If a step fails, the trace shows which step, with the file name and partner attached – not four disconnected error logs in four services that you get to correlate by timestamp, at 02:00, using vibes.
(Granularity question people always ask: per file or per order? Start per file. If one bad order in a batch of 500 matters to you, add child spans per order under the parse step, spans are cheap. Per-order traces only make sense when orders truly travel independently.)
Step 2: tag every boundary
Spans get useful when they say which data boundary they crossed. In Sluicio we lean on two small attributes on boundary-crossing spans, and they’re deliberately boring:
io.kind— what kind of boundary:file,queue,stream,http,db,emailio.role— which direction:inputoroutput
Plus the standard OTel semantic conventions for the details. For our four hops:
| Span | Key attributes |
|---|---|
edi-gateway receive |
io.kind=file, io.role=input, file.name, transfer.source.host, transfer.protocol=sftp |
edi-parser parse |
partner.id=ACME, edi.message_type=ORDERS, order.count=47 |
order-transformer |
(internal – no boundary, no io.* needed) |
erp-connector deliver |
io.kind=http, io.role=output, http.method=POST, http.status_code, net.peer.name=erp.internal |
Why bother? Because these attributes are what turn a flat pile of spans into a dashboard that knows what your service does. Sluicio reads them and classifies each service automatically: the gateway becomes a file-input service and gets pickup rates and source-host widgets; the connector becomes http-output and gets status codes and latency per endpoint. No configuration, the telemetry describes the topology, the UI follows.
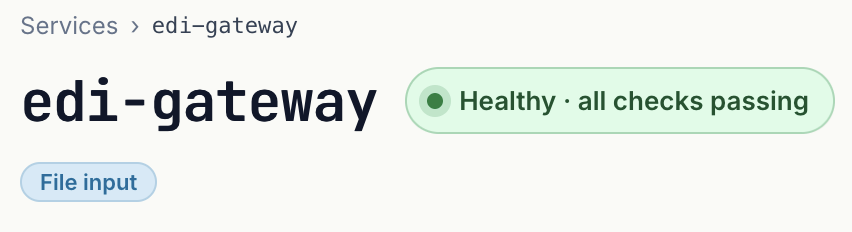
And if you can’t re-instrument a service to emit io.kind, a vendor black box, a legacy job nobody dares touch, you can map it in the UI instead: “for this service, treat spans where messaging.system exists as queue-input.” The telemetry stays untouched; the classification still works.
Step 3: the honest version – you don’t need all of this on day one
Confession from our own cells: some of the best-monitored integrations in there are a single span. A .NET timer job that wraps its whole run in one root span, “Export contacts to CRM,” nine seconds, done – with exactly two custom attributes: sourceSystem and targetSystem.
That’s it. And it’s already enough to answer the questions that matter: did it run, when, how long, did it fail, and which flow does it belong to. The four-hop trace above is where you end up, not where you’re required to start. One well-attributed root span per run beats fourteen beautifully nested spans you never shipped because the instrumentation ticket kept slipping.
Start with one span per run. Add child spans when a failure makes you wish you had them. That’s the whole methodology.
Step 4: make it an integration, not four services
Here’s where most observability tools stop and Sluicio starts. Four healthy services do not equal one healthy flow — the flow is the thing your business cares about, so the flow is the thing that should have a health status.
In Sluicio you group those services into an integration, “Acme partner orders”, and the flow becomes a first-class object with its own rolled-up status, its own trace list, and its own metadata: priority (P1, because sales calls), a contact person (the poor soul who gets the call), and — the quietly load-bearing one — expected messages per hour.
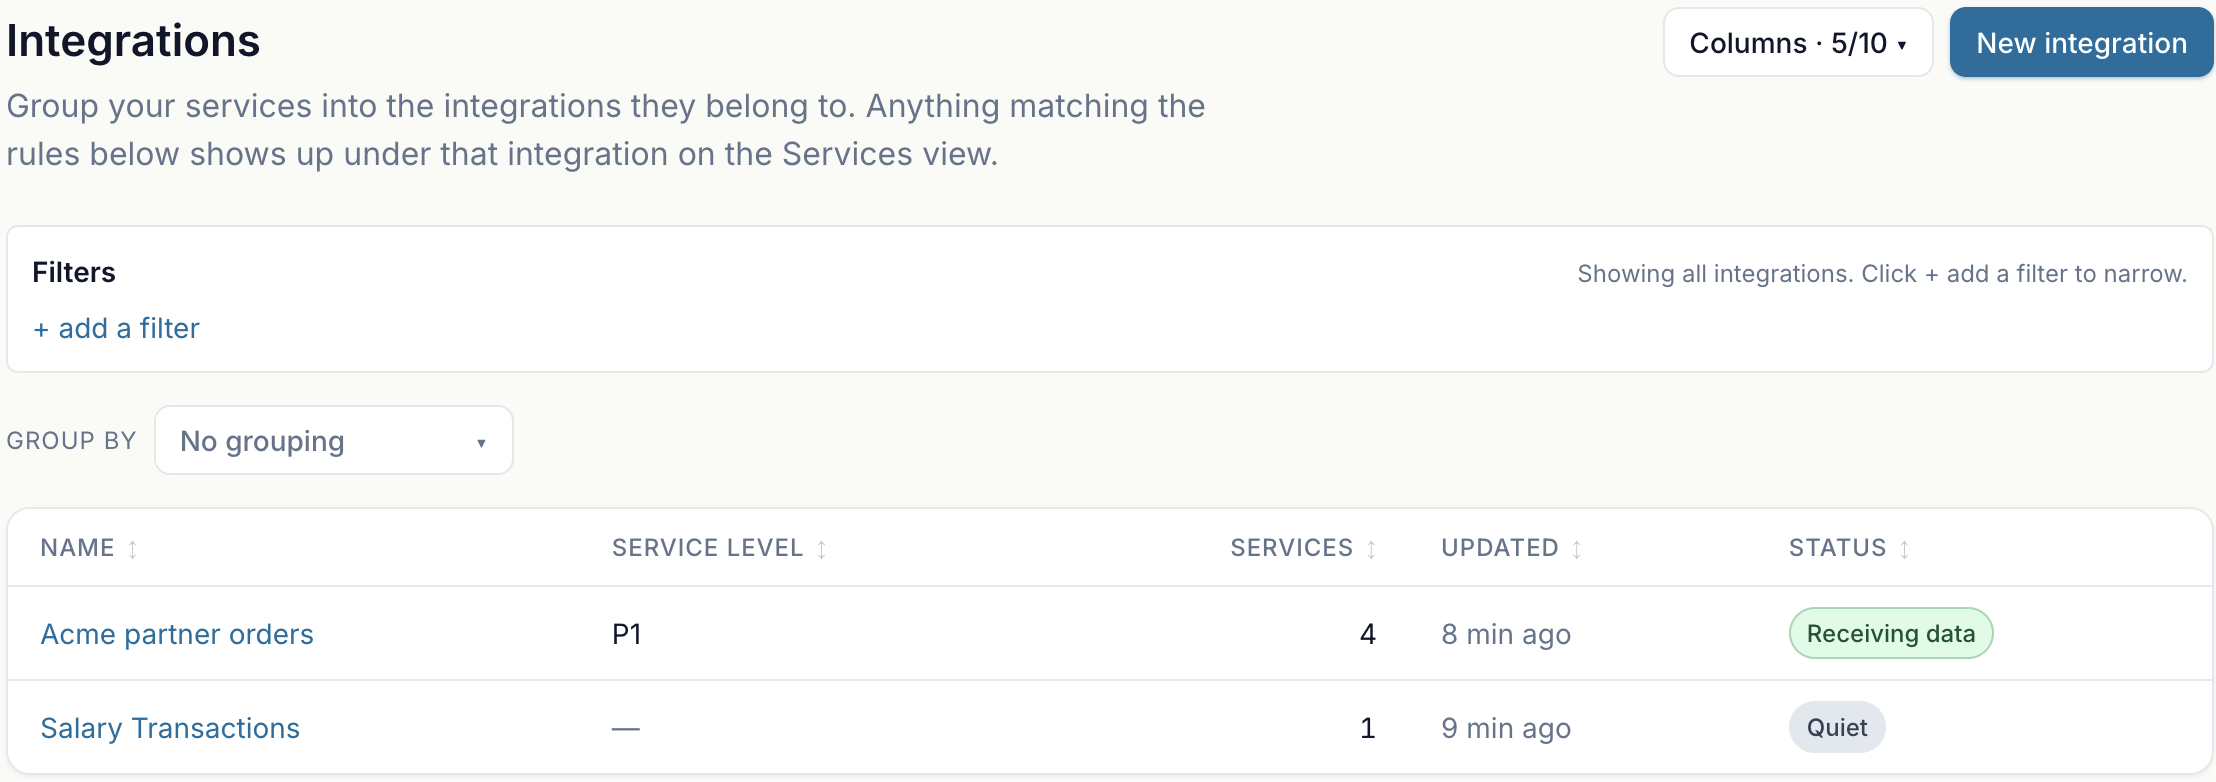
That last field is the answer to the failure mode from the top of this post. Errors are easy; anything can alert on a red span. But when Acme’s export dies on their side, there are no red spans. There’s nothing at all. Because the integration knows a file should arrive roughly nightly, its status flips to quiet when one doesn’t, and you find out Monday at 08:00 from a dashboard, not Thursday at 14:00 from sales.
The recipe, condensed
One trace per business event, following the data, not the request. A span at every boundary, tagged with io.kind and io.role plus standard semantic conventions. Start with a single root span per run if that’s what you can ship this week, it’s genuinely enough. Then group the services into an integration and tell it what “normal” looks like, so silence becomes an alert instead of a surprise.
Your EDI flow will never be a lovely request/response diagram. It can still be the best-instrumented thing you run.
Sluicio is self-hosted integration monitoring on OpenTelemetry. If you’ve got a flow like this held together by hope and a cron job, book an intro call or poke the live demo.